To address GHG mitigation, the authors cited have developed a farm-level system dynamics model, Dairy Environment Sustainability Tool (DESTiny) [https://assetresearch.org.za/on-farm-carbon-capture-and-storage-capacity/] that assesses emissions alongside carbon capture and storage on farms. The model will help determine whether farms act as net emitters or sequestrators of carbon. It is also designed to assist dairy farmers in adopting sustainable practices while enhancing competitiveness and financial viability. It has been designed as a science-informed, evidence-based tool for estimating, monitoring and understanding nutrient and carbon flows within dairy production systems. Its user-friendly interface allows remote access for researchers, practitioners, farmers and technicians while integrating the system dynamics model with on-farm data.
As a follow-up to the development of the model, it has been applied on 12 different pasture-based dairy farms to test the model’s efficacy under different production practices. The results were satisfactory, enabling effective distinguishing between differences. These are summarized below.
Figure 1 depicts the greenhouse gas (GHG) emissions in kg CO₂e per kg FPCM (fat and protein corrected milk) and milk production per cow per day, illustrating the relationship between milk yield and GHG emissions, and the GHG contributing entities.
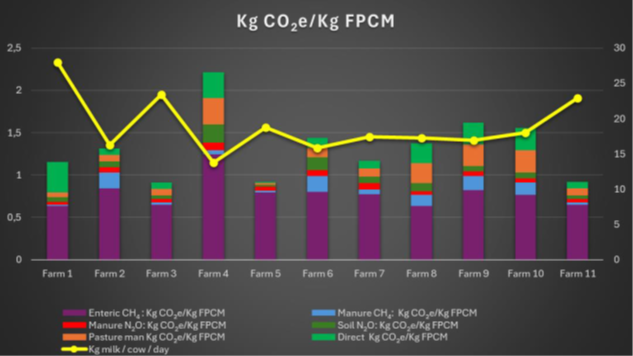
The stacked bars in the graph represent GHG emissions from various sources. Enteric CH₄, shown in purple, is by far the largest contributor to emissions across all farms. Manure N₂O, displayed in red, contributes moderately, while manure CH₄, represented in blue, is a smaller contributor. Soil N₂O, indicated in dark green, varies depending on the farm, and pasture management emissions, shown in orange, are relatively small but present on some farms. Direct emissions (electricity, fuel, etc), represented in light green, may also be significant contributors. The yellow line on the graph illustrates daily milk yield per cow (in kg FPCM). Farms with higher milk production tended to have lower emissions per unit of milk produced; for example, Farms 1, 3, 5 and 11 demonstrated higher milk yield but comparatively lower emissions per kg FPCM. There was also significant variability across farms in both emissions and milk yield. Farm 4 had the highest emissions per kg of FPCM, likely due to lower efficiency, while Farm 11 exhibited high milk production with moderate emissions, suggesting better sustainability practices. The relationship between milk yield and GHG emissions is, however, not highly correlated, and therefore, focusing solely on milk yield will overlook other critical factors in sustainability.
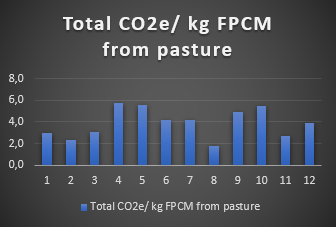
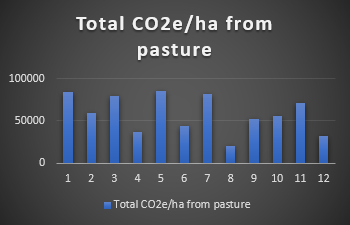
What eventually is the bottom line, is net emissions, meaning the difference between CO₂e emissions and sequestration/sink (calculated as total biogenic-C in CO₂e). Biogenic-C can be calculated and expressed relative to FPCM, pasture biomass or Large Stock Unit (LSU), to illustrate how farms differ in sequestration/sink capacity, and therefore in eventual net emissions. Figures 2, 3 and 4 show this for farms 1 to 12.
| Figure 2: Total biogenic-C in kg CO₂e/kg FPCM. | Figure 3: Total biogenic-C in kg CO₂e/ha pasture. | Figure 4: Total biogenic-C in kg CO₂e/LSU on pasture |
 |
 |
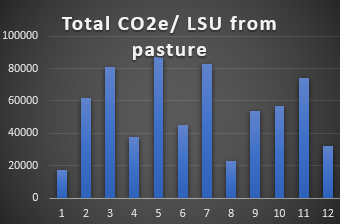 |
Figures 2, 3 and 4 illustrate that the farms differ in biogenic-C depending on comparison method, which will affect net emissions. Of significance also is comparison between GHG emissions per FPCM of Farm 4 (Figure 1) with its biogenic-C per FPCM (Figure 2). It shows very high GHG emissions, but also comparatively high biogenic-C, implying that its net emissions may be acceptable.
Emissions per ha on pasture are determined by plant biomass, management procedures and stocking rate, whereas per LSU an additional factor is the ratio of cows in milk, vs dry cows and heifers. The poorer this ratio, the higher will be the GHG emissions from pasture. It will also depend on the size of the cattle. Thus, apart from milk production level, a more comprehensive approach should also consider land use, resource efficiency and the broader environmental impact of a dairy farm or system.
If the results of the 12 farms are evaluated in terms of net emissions (emissions – biogenic-C), 11 of the 12 farms functioned as net carbon sinks, capturing more C than they emit. Emissions ranged between -2.31 to +0.34 kg CO₂e per kg of FPCM, illustrating what we have come to realize, namely that effective resource and pasture management on dairy farms will assist in mitigating accumulation of GHG. However, as shown by the farm emission differences of 0.96 to 2.3kg CO₂e/kg FPCM in Figure 1, much can be done on particular farms to improve in order for pasture-based dairy farming to meet its obligation in reducing GHG and climate change.